Chapter 15
Visualization Facilities
15.1 Overview
In this chapter we describe how visualization facilities are provided to the applications based on the Gaudi framework. We present how we interface the physics event data objects, detector components or statistical objects to their graphical representation. One example of an application that uses the visualization services is an event display program. With this program we display graphically the event data from files or being acquired by the data acquisition. Another example could be an interactive analysis program that combines in the same application histogramming or manipulation of statistical entities, event display, and full interactive control by the end user of the data objects and algorithms of the application.
In the current release, these visualization services are at the level of a prototype. We have implemented the mechanism of converting event and detector objects into their graphical representation and built one example application. This application can serve as a proof of concept and can also be used to help in the development of physics algorithms (e.g. pattern recognition) or in the verification of the detector geometry.
15.2 The data visualization model
The Gaudi architecture envisaged implementing data visualization using a similar pattern to data persistency. We do not want to implement visualization methods in each data object. In other words, we do not want to tell an object to "draw" itself. Instead we would implement converters as separate entities that are able to create specific graphical representations for each type of data object and for each graphical package that we would like to use. In that way, as for the persistency case, we decouple the definition and behaviour of the data objects from the various technologies for graphics. We could configure at run time to have 2D or 3D graphics depending on the needs of the end-user at that moment.
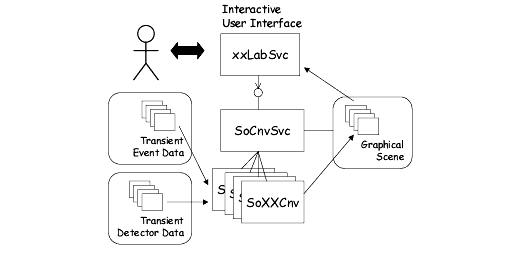
Figure 15.1 illustrates the components that need to be included in an application to make it capable of visualizing data objects. The interactive user interface is a Service which allows the end-user to interact with all the components of the application. The user could select which objects to display, which algorithms to run, what properties of which algorithm to inspect and modify, etc. This interaction can be implemented using a graphical user interface or by using a scripting language.
The User interface service is also in charge of managing one or more GUI windows where views of the graphical representations are going to be displayed.
Figure 15.1 Components for visualization
The other main component is a Conversion Service that handles the conversion of objects into their graphical representation. This service requires the help of a number of specialized converters, one for each type of data object that needs to be graphically displayed. The transient store of graphical representations is shared by the conversion service, together with the converters, and the user interface component. The form of this transient store depends on the choice of graphics package. Typically it is the user interface component that would trigger the conversion service to start the conversion of a number of objects (next event), but this service can also be triggered by any algorithm that would like to display some objects.
15.3 The GaudiLab service
15.3.1 Design layout
GaudiLab uses the OnX(ML) package to drive interactivity. From an XML description of the graphical user interface (GUI), OnX creates an application GUI by using various "toolkits" like Motif, Win32, GTK+. It permits also to handle various scripting languages (currently tcl, CINT, KUIP) in the GUI XML files, to describe the behaviour of the GUI pieces.
The graphics are handled by Open Inventor. The Inventor "viewers", being part of the GUI, are created by OnX from a placement in the application GUI XML files.
Connection to Gaudi is done through the wrapping of Gaudi C++ code to scripting languages. For example the "Next event" button executes the tcl script :
eraseEvent;gaudiLab nextEvent
The eraseEvent is a tcl script that erases the event Inventor scene graph (but not the "detector" Inventor scene graph). "gaudiLab nextEvent" executes the Gaudi ApplicationMgr "nextEvent(1)" method (through an instance of the "main" GaudiLab class, dynamically loaded by OnX tools).
Inventor modeling of the LHCb detector and event data is driven by the "Lab service" (LabSvc class). The Lab service, from a textual request coming from the GUI (like "visualize /dd/Structure/LHCb/Muon"), drives the adequate Gaudi Inventor converters (the So<xxx>Cnv classes) to produce Inventor scene graphs.
The SoDetElemCnv and SoLVolumeCnv build the Inventor scene graph for the detector. The other ones (like SoMCParticleCnv) build Inventor scene graphs for event data.
15.3.2 Getting Started
15.3.2.1 Preparing the environment
GaudiLab requires the standard LHCb environment. At CERN this is set up automatically when you login. If you do not work at CERN, you can look at the GaudiLab/cmt/login_lal.csh file to have an idea of which environment variables are needed for a local installation of everything.
15.3.2.2 Starting the programs, being owner of the GaudiLab installation
If you are the owner of the GaudiLab installation (i.e. you have write access to the GaudiLab/user directory), you should be able to type the following :
UNIX> cd <path><GaudiLab>/<version>/cmt
(csh> source login_cern.csh)
csh> source setup.csh
csh> cd ../user
csh> setenv DISPLAY ...
csh> setenv ONXUI ogtk.xml
csh> ogtk (to start OnX gtk GUI manager)
DOS> cd <path>\<GaudiLab>\<version>\cmt
DOS> call setup.bat
DOS> cd ..\user
DOS> %owin32% (to start OnX Win32 GUI manager)
or if working with gtk (today the most advanced GUI) :
DOS> set ONXUI=ogtk.xml
DOS> %ogtk% (to start OnX gtk GUI manager)
A main panel should appear. If not, you are in a mess, check :
· LHCb software installation (try the GaudiExamples).
· OnX package installation (see OnX doc to try some stand alone examples).
· GaudiLab installation.
· LHCb environment variables.
· The DISPLAY environment variable.
If all seem ok, contact the GaudiLab support : G.Barrand barrand@lal.in2p3.fr.
Note that the GaudiLab package is at the top of a whole chain of packages and that a good behaviour relies on a good installation of the underlying packages.
15.3.2.3 Starting the programs, not being owner of the GaudiLab installation
If you are not the owner of the GaudiLab installation (for example wotking with the GaudiLab installed at CERN) :
UNIX> cd
UNIX> mkdir tmp
UNIX> cd tmp
(csh> source <path><GaudiLab>/<version>/cmt/login_cern.csh)
csh> source <path><GaudiLab>/<version>/cmt/setup.csh
UNIX> cp -R $GAUDILABROOT/user .
UNIX> cd user
csh> setenv ONXUI ogtk.xml
csh> ogtk (to start OnX gtk GUI manager)
DOS> mkdir tmp
DOS> cd tmp
DOS> call <path>\<GaudiLab>\<version>\cmt\setup.bat
DOS> xcopy %GAUDILABROOT%\user .
DOS> cd user
DOS> %owin32% (to start OnX Win32 GUI manager)
or if working with gtk (today the most advanced GUI) :
DOS> set ONXUI=ogtk.xml
DOS> %ogtk% (to start OnX gtk GUI manager)
15.3.3 Customization
The user directory (the GaudiLab one or a local copy) contains the GaudiLab.txt, ogtk.xml (xml GUI file for gtk), a copy of a debugged detector description, the init.tcl file,.... These files control the run time environment and could be edited for strong customization of things.
15.3.4 The available GUI menus.
The ogtk.xml (or main.xml if working with Motif or Win32) contains a set of menus. All these could be customized by editing the XML file.
· File :
· Console : map the output console.
· Exec tcl... : map a file chooser to pick a tcl file and execute it.
· Session.tcl : execute (if it exisists) the session.tcl found in the current directory.
· stdout : redirect output from console to stdout.
· Continue : exit from a secondary GUI event loop.
· Exit : exit the program.
· Viewer : for manipulation in the current viewer (or page).
· 1x1, 2x2, 1x2, 2x1 : set a grid of viewport regions in the current viewer.
· next : set the current active viewport region (the one with a red border) to the neightbourg one (left to rigth, top to bottom).
· Region page : map the current region to the whole viewer.
· 2D, 3D : prepare the region for a 2D (for exa histo plotting) or 3D rendering.
· black, white, grey back : set background color of the current region.
· view all : map the viewport camera viewing to match the bounding box scene.
· GIF, xv : produce a out.gif GIF file of the viewer ; spawn xv over the out.gif file.
· PS, gv : (for 2D scenes) produce a out.ps PS file of the viewer ; spawn ghostview over the out.ps file.
· reset page : reset to a 1x1 viewer.
· erase page : clear the regions.
· erase region : clear only the current region.
· erase static : delete the "static" scene graph of the current region. In principle detector representations are put under the static scene graph. Then "erase static" will clear the detector representations.
· erase dynamic : delete the "dynamic" scene graph of the current region. In principle event data representations are put under the dynamic scene graph. Then "erase dynamic" will clear the detector representations.
· Page title on/off : set/remove global page title.
· Color : map a color chooser to set current modeling color (usefull when working with Tree/vis).
· Detector : visualize various parts of the detector.
· Event :
· Next event : bring a new event in memory (at startup no event is loaded).
· MCParticle,... : visualize event data.
· Tree : if the GUI (for exa gtk+) permits a tree visualization of the event, the item under this pulldown menu permits action over the selected item in the tree GUI widget.
· Vis : visualize the selected item in the tree widget.
· Viewers : list of viewers. Permit to change the active one.
15.3.5 3D controls
3D Inventor examiner viewer controls are :
· right mouse button : popup menu.
· right/popup/decorations : enable the Inventor "decorations" (not available for all GUI).
· decoration/"pointer" : pass pointer in picking mode.
· decoration/"hand" : pass pointer in viewing mode.
· popup/viewing : toggle pointer mode (viewing to picking).
· decoration/"eye" or popup/view all : map the scene to the window size.
· decoration/"home" or popup/home : return to home position.
· decoration/"home+pointer" or popup/Set home : set home position to be the current one.
· decoration/"target" or popup/Seek : ask for picking and center the scene over a picked point.
· left + ptr move : permits to rotate the scene.
· left + middle + ptr move : permit to scale the scene.
· ctrl + shift + left + ptr move : permits to scale the scene.
· ctrl + left + ptr move : permits to pane the scene.
· middle + ptr move : permit to pane the scene.
15.3.6 Writing graphic converters
The role of each converter So<xxx>Cnv is to produce an Open Inventor node that represents the object. The following fragment of code shows how this is done for the geometry of a detector element.The code has been simplyfied to be more illustrative. The 3D graphical objects that are created are standard OpenInventor objects (in bold).
|
Quadralay Corporation http://www.webworks.com Voice: (512) 719-3399 Fax: (512) 719-3606 sales@webworks.com |